Traveling Salesman Problem Task
Description
A visual-spatial planning task where participants find the shortest path through a set of points, returning to the starting point, to assess route optimization and spatial reasoning.
Measures: Spatial planning and reasoning, route optimization ability, visual-spatial problem solving, heuristic decision-making, and the balance between speed and solution quality in complex spatial tasks.
Visuospatial Planning Problem Solving
Ages: 12+ · Populations: adults, research, clinical
About This Test
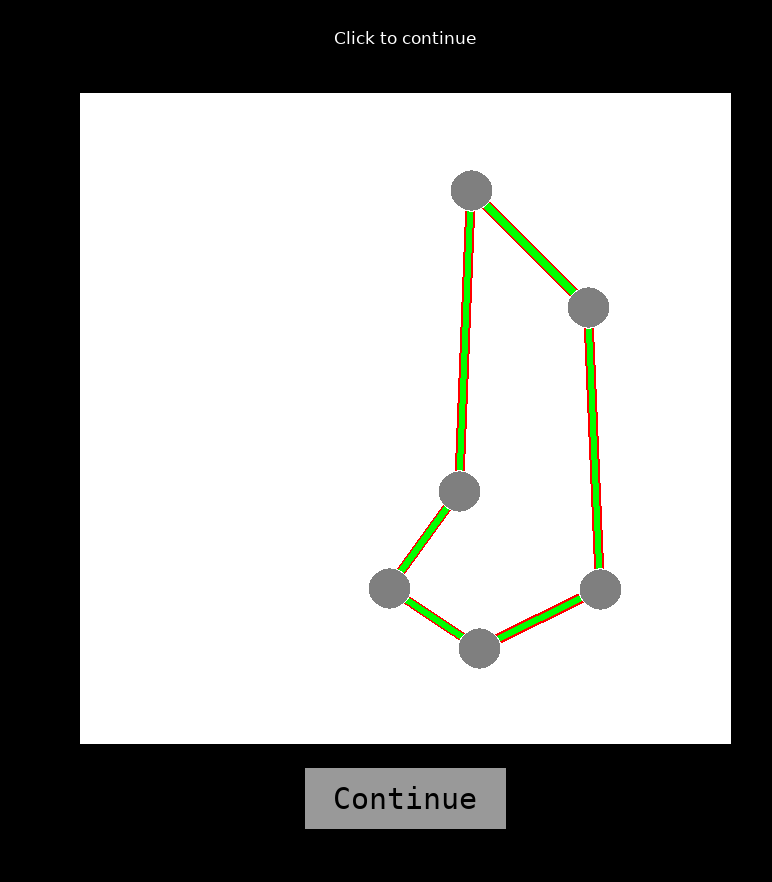
Participants view a set of points on the screen and must click through each point exactly once, finding the shortest possible route and returning to the starting grey circle. The task begins with a practice phase (6-point problems) followed by test trials with varying difficulty (10, 20, or 30 points). After completing each route, participants receive feedback showing their path efficiency compared to the optimal solution. Performance is measured by both path efficiency and solution time.
- Migrated to PEBL 2.3 with HTML-lite markup on February 1, 2026
- Supports 10 language translations: English, Spanish, French, German, Italian, Dutch, Portuguese, Chinese, Greek, Turkish
- Default uses subset.csv with pre-selected 15 problems for ~10 minute session
- Includes reliability and normative data (Mueller et al., in submission)
- Tour files can be generated from Concorde TSP solver output using tours/processTSPFile.R
- Additional tour problems available in tours/tours2.zip and tours/TSP.zip
- Supports both click and touch input modes with optional visual/audio feedback
- Backup feature allows participants to undo mistakes (can be disabled)
- Provides immediate efficiency feedback with optimal path visualization
Test Details
tsptsp.pbl🚀 Try Without Registration
Run this test immediately without creating an account. Data stays in your browser.
Researcher Access Benefits
To save configurations, upload data, use translations, track completion, and manage studies, please log in or register for an account.
Scientific Background
Original Task References:
These references describe the original task that this PEBL implementation is based on.
- MacGregor, J. N., & Ormerod, T. (1996). Human performance on the traveling salesman problem. Perception & Psychophysics, 58(4), 527-539.
- Vickers, D., Bovet, P., Lee, M. D., & Hughes, P. (2003). The perception of minimal structures: Performance on open and closed versions of visually presented Euclidean travelling salesperson problems. Perception, 32(7), 871-886.
PEBL-Specific References:
These studies used the PEBL version of this task.
- Mueller, S. T., Perelman, B. S., Tan, Y. Y., & Thanasuan, K. (2015). Development of the PEBL Traveling Salesman Problem Computerized Testbed. The Journal of Problem Solving, 8(1), 4.
Validation status: In-progress · Psychometric data available · Normative data available
Related Tests
Data Output
Creates four data files: (1) tsp-<subnum>.csv with click-by-click data; (2) tsp-sum-<subnum>.csv with trial summary data; (3) tsp-report-<subnum>.txt with performance summary; (4) tsp-log.txt with session timestamps. A fifth file (tsp-pooled.csv) aggregates data across all participants.
Key Variables
| Variable | Description |
|---|---|
| subnum | Participant identifier code |
| trial | Trial number |
| test | Tour file path (e.g., 'tours/tour-10-01.txt') |
| type | Trial type: PRACTICE or TEST |
| point | Point number in the clicked sequence (0=starting point) |
| targx, targy | Target position coordinates on screen |
| clickX, clickY | Actual click coordinates |
| opt | Optimal (shortest possible) path distance in pixels |
| obs | Observed (participant's) path distance in pixels |
| eff | Efficiency ratio (obs/opt): 1.0 = perfect, >1.0 = longer than optimal |
| elapsedtime | Total time to complete trial in milliseconds |
| rt | Response time for each click in milliseconds |
Example Data
| subnum | trial | test | type | starttime | firstclick | endtime | elapsedtime | numpos | opt | obs | eff | |
|---|---|---|---|---|---|---|---|---|---|---|---|---|
| example | 1 | tours/example06-01.txt | PRACTICE | 30814 | 33310 | 35939 | 5125 | 6 | 1213.1 | 1213.1 | 1 | |
| example | 2 | tours/example06-02.txt | PRACTICE | 37850 | 38890 | 42334 | 4484 | 6 | 1111.36 | 1111.36 | 1 | |
| example | 3 | tours/example06-03.txt | PRACTICE | 43290 | 44850 | 47928 | 4638 | 6 | 1173.78 | 1173.78 | 1 | |
| example | 4 | tours/example06-04.txt | PRACTICE | 49306 | 50731 | 54772 | 5466 | 6 | 1253.43 | 1253.43 | 1 | |
| example | 5 | tours/example06-05.txt | PRACTICE | 56487 | 58307 | 61041 | 4554 | 6 | 1522.37 | 1522.37 | 1 | |
| example | 6 | tours/tour-10-08.txt | TEST | 63782 | 65116 | 71035 | 7253 | 10 | 1459.27 | 1459.27 | 1 | |
| example | 7 | tours/tour-30-05.txt | TEST | 71844 | 73585 | 105292 | 33448 | 30 | 2520.7 | 2554.04 | 1.01323 | |
| example | 8 | tours/tour-20-12.txt | TEST | 107436 | 108834 | 132411 | 24975 | 20 | 2142.94 | 2289.73 | 1.0685 | |
| example | 9 | tours/tour-10-07.txt | TEST | 136674 | 140363 | 146182 | 9508 | 10 | 1689.15 | 1689.15 | 1 |
Sample data showing typical output format. Actual values will vary by participant.
About This Test
A visual-spatial planning task where participants find the shortest path through a set of points, returning to the starting point, to assess route optimization and spatial reasoning.
Category: Executive Function
Estimated Duration: 10 minutes
Available Translations: 10 languages
Documentation Sources:
Test description file, Test implementation, Parameter schema
Documentation Status: Complete